
Better data. Better research.
Health research often depends on snapshots: a survey, a clinic visit, or a participant trying to remember what they ate, how well they slept, or how active they were weeks or even months before. TakeCare Health offers researchers longitudinal health data captured as people live their everyday lives. By bringing nutrition, sleep, activity, hydration, medications, symptoms, weight, and much more together over time, TakeCare helps researchers work with more accurate and detailed health information.
$299.99 a month · up to 20 team members · free for participants
Daily life, recorded as it happens
Participants use TakeCare to manage their own health, so they keep logging long after a study diary would have been abandoned. You get the record, with every value traced to where it came from.
Data that keeps coming
Participants use TakeCare for their own health every day, so their records keep growing long after they join.
Know your data’s limits
Completeness, gaps and sources are measured for you, so you can set inclusion rules before you analyze.
Define cohorts precisely
Combine demographics, conditions, medicines, data requirements and health measures, with counts that update as you go.
Reproducible by default
Every column is documented with its source and derivation, and every export records its criteria and algorithm version.
From question to analysis-ready data
Define who you want to study, check whether their data can answer your question, look before you leap, then export exactly what you need.
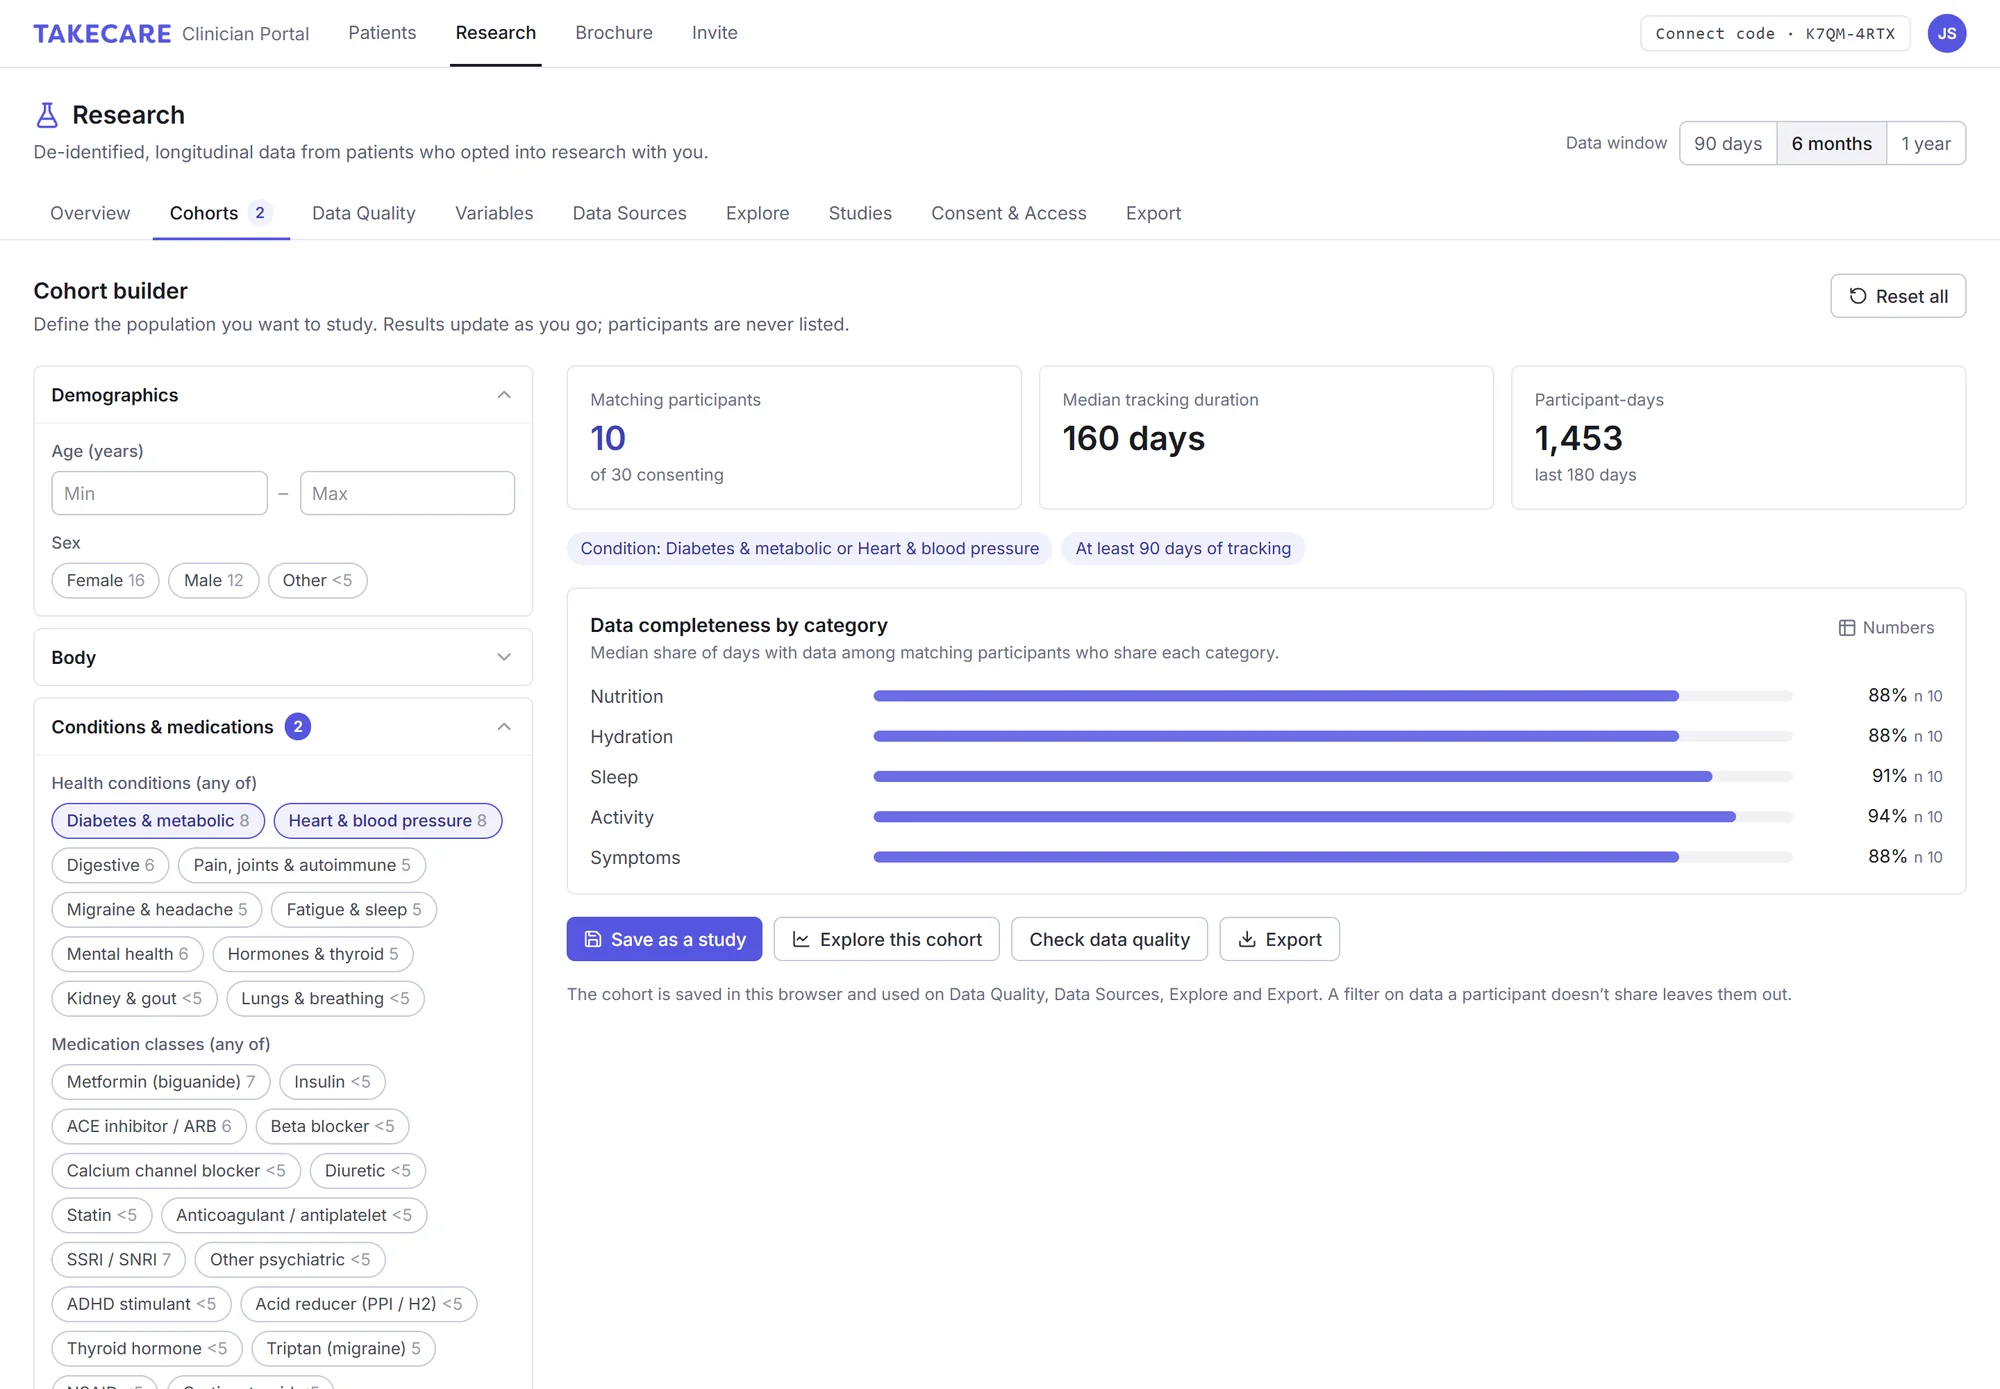
Define your population in seconds
Pick your criteria and see straight away how many participants match, how long they’ve been tracking and how complete their data is.
- Demographics and body: age, sex, BMI and weight
- 11 condition groups and 20 medication classes, from metformin and statins to SSRIs, triptans and inhalers
- Data requirements: tracking duration, completeness per category, sleep nights per week, wearable or manual data
- Health measures: average sleep, steps, calories, sodium, water and symptom ratings, then save the cohort as a study or send it straight to export
Know what your data can answer
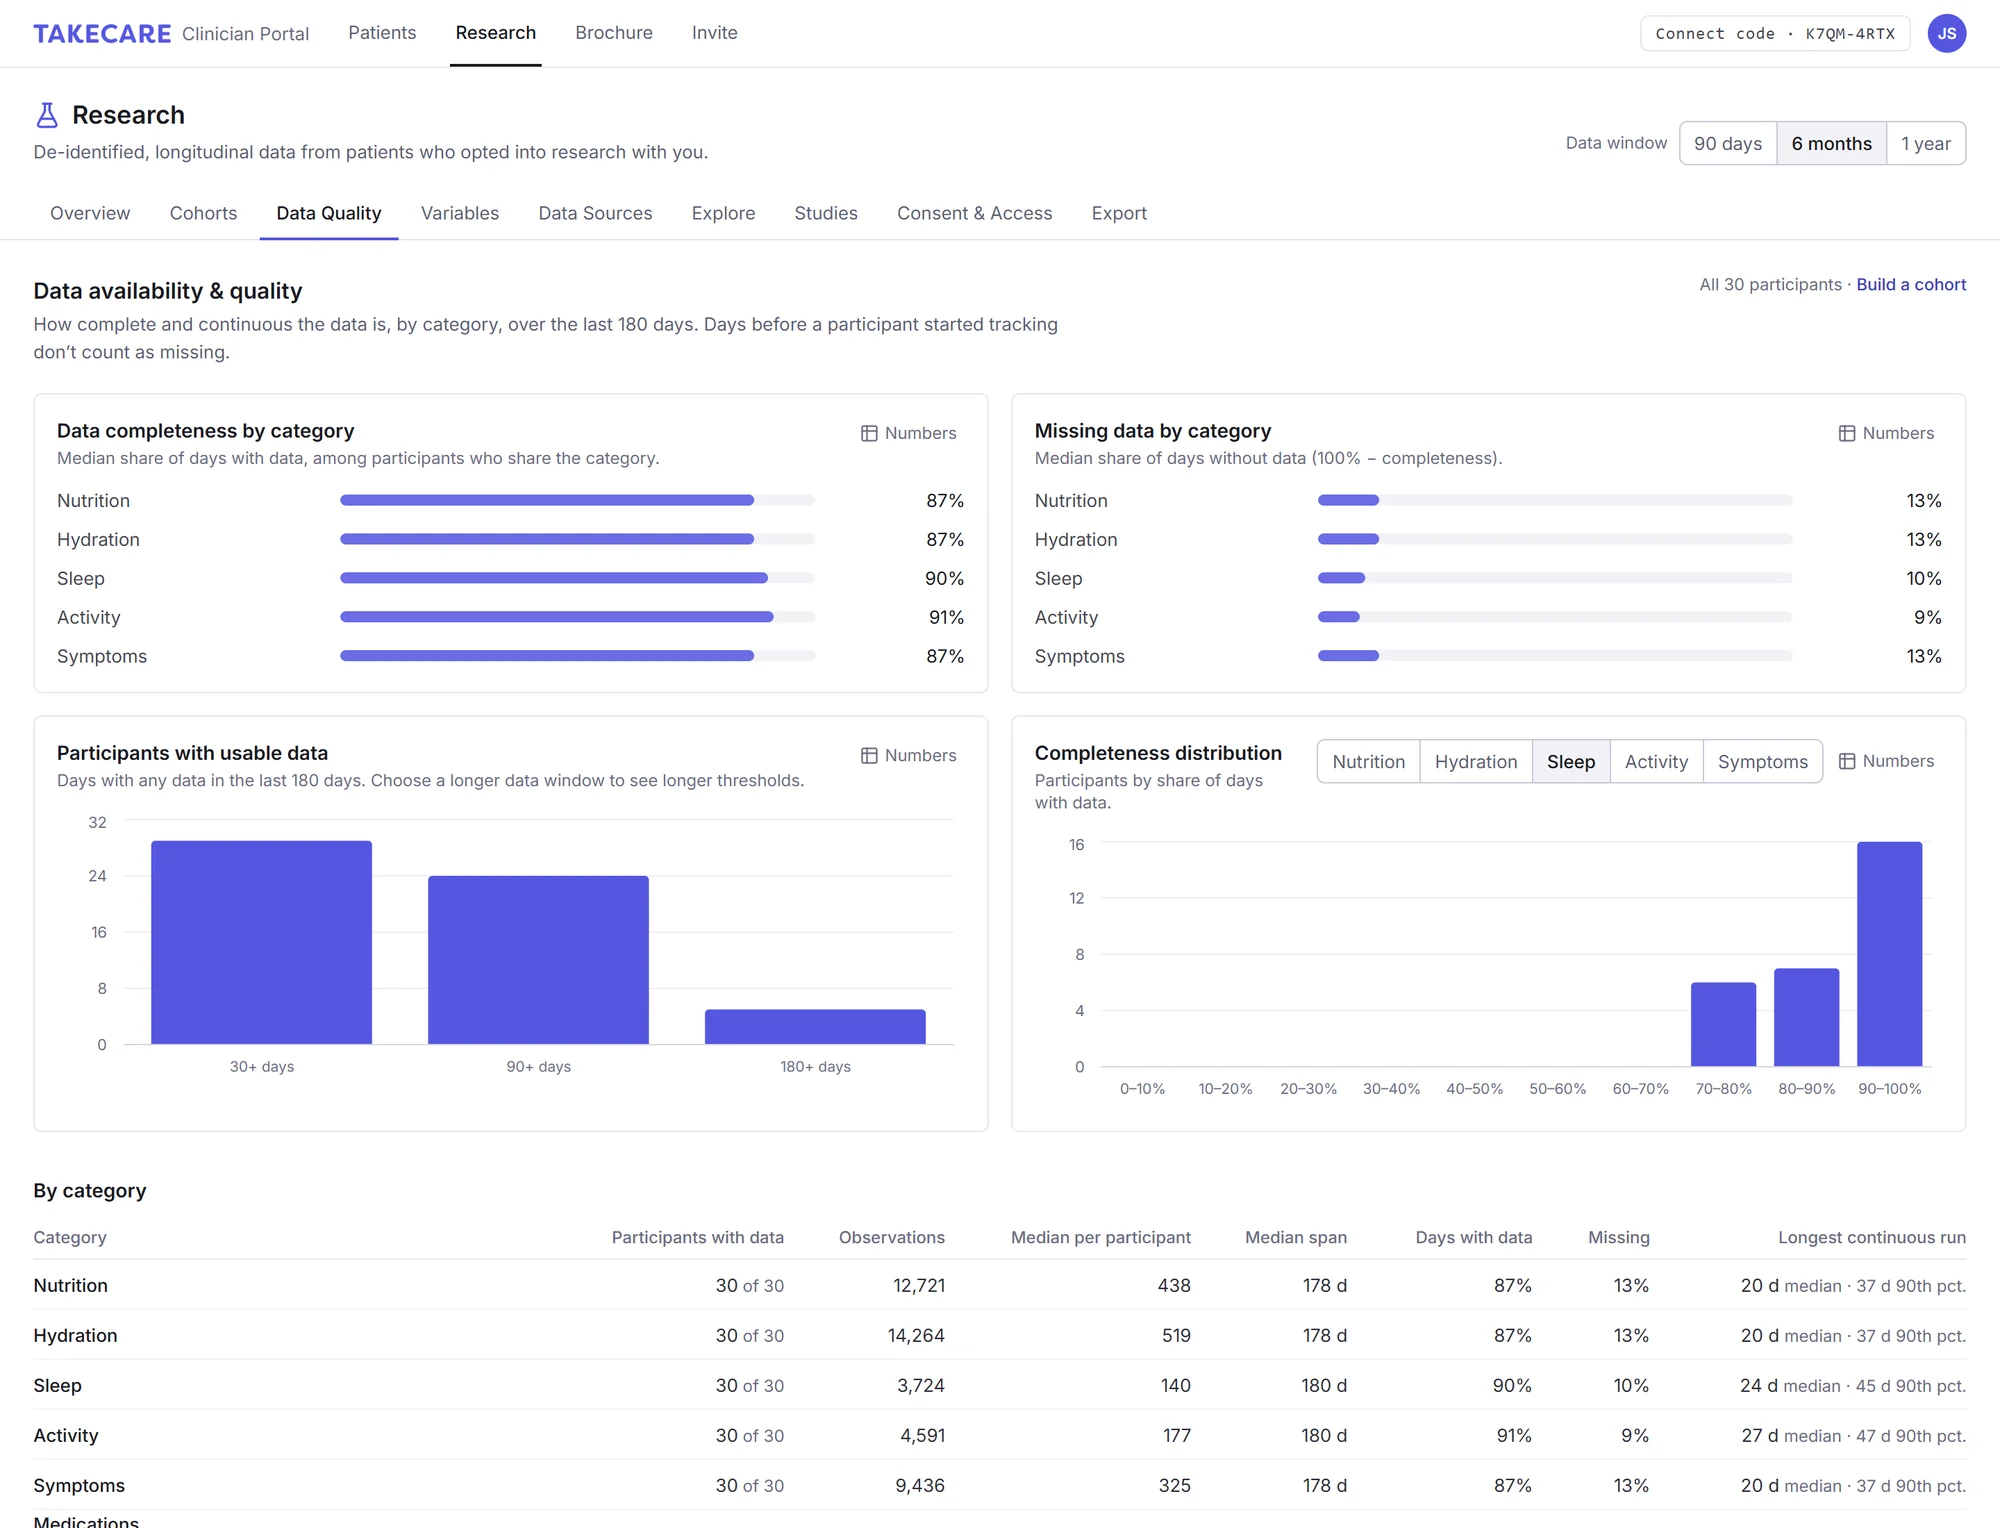
Real-world data has gaps. TakeCare measures them, by category and by participant, so you can set inclusion rules with confidence. Days before a participant started tracking never count as missing.
- Completeness and missingness for nutrition, hydration, sleep, activity and symptoms
- Participants with usable data at 30, 90, 180 and 365 days, and the spread of completeness
- Observations, spans and longest continuous runs per category
Look before you analyze
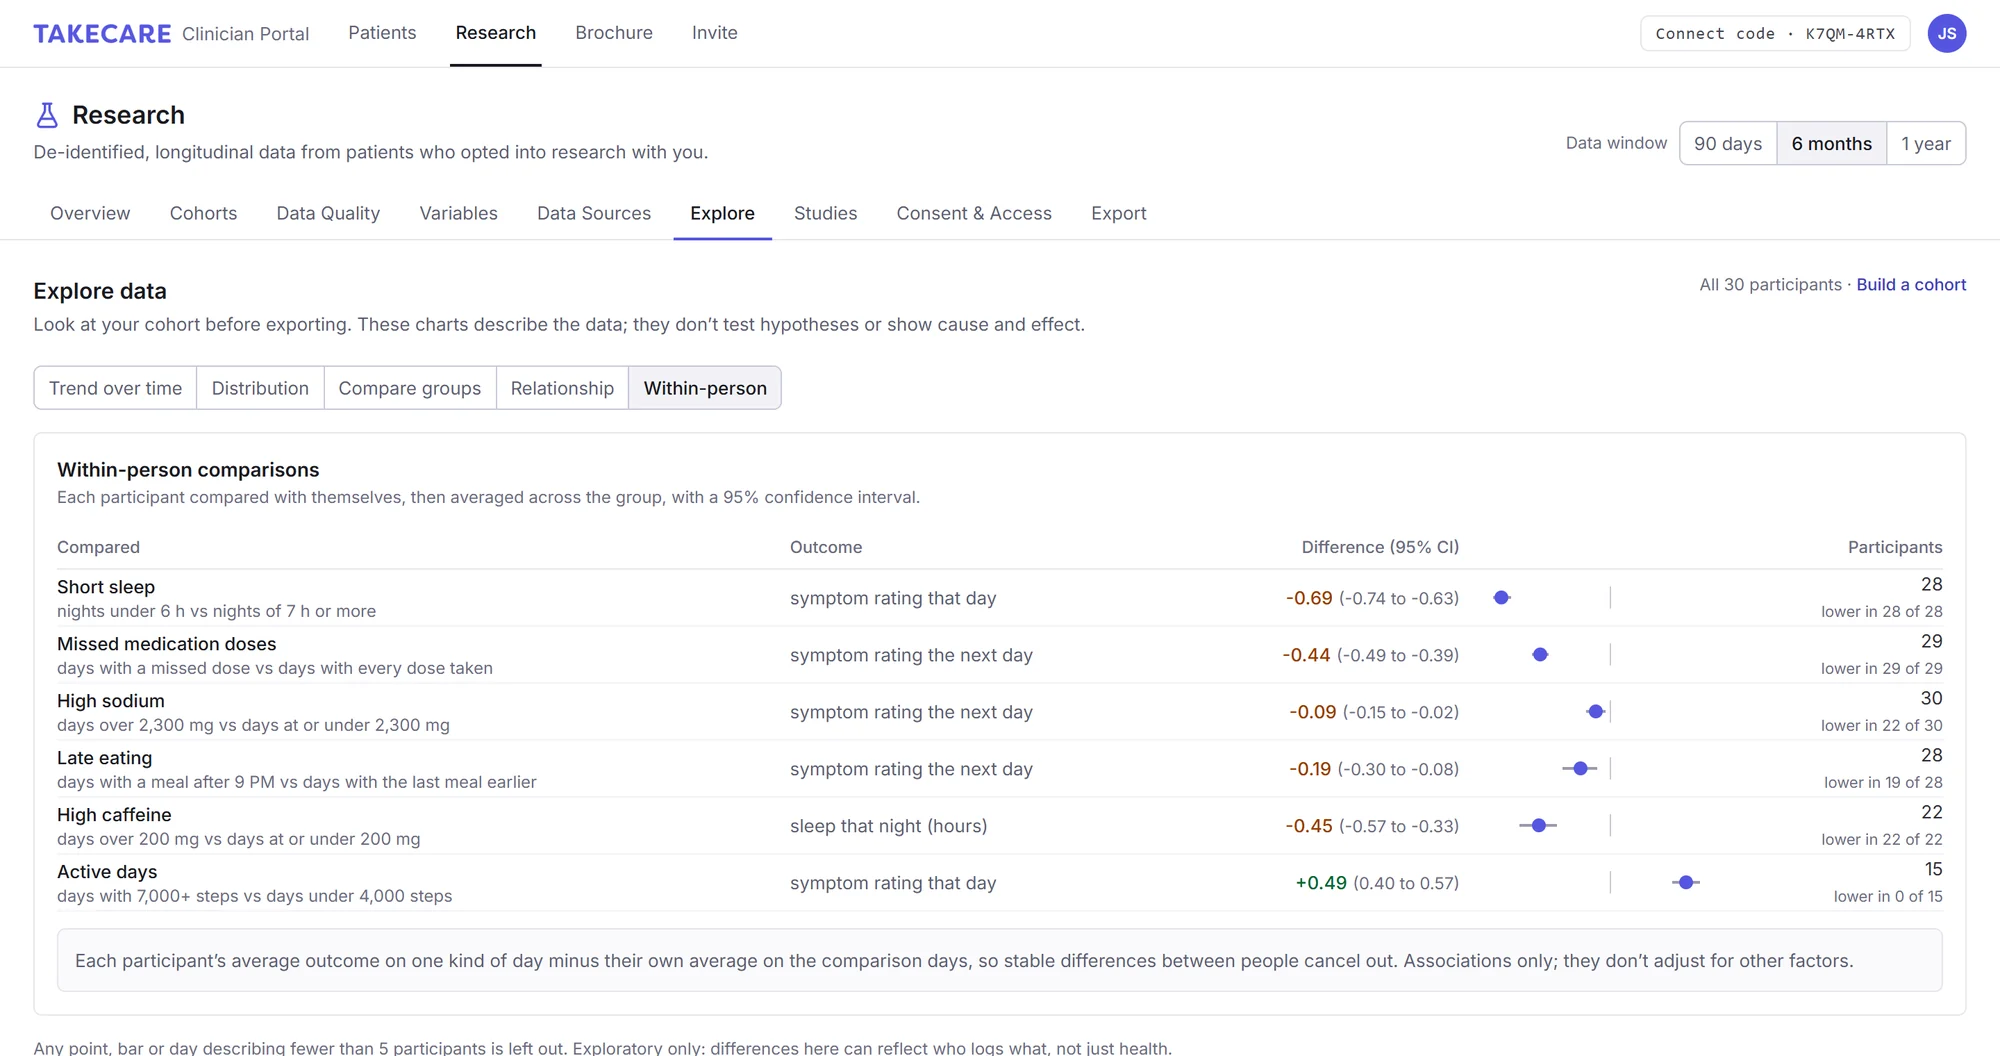
Five views to get to know your cohort, including within-person comparisons that set each participant against themselves, so stable differences between people cancel out.
- Ready-made comparisons: short sleep, missed doses, high sodium, late eating, high caffeine and active days, against symptoms or sleep
- 95% confidence intervals and how many participants moved in each direction
- Trends and group comparisons by sex, age group, condition, BMI group, medication class or wearable, and relationships on the same day or the next
Every value knows where it came from
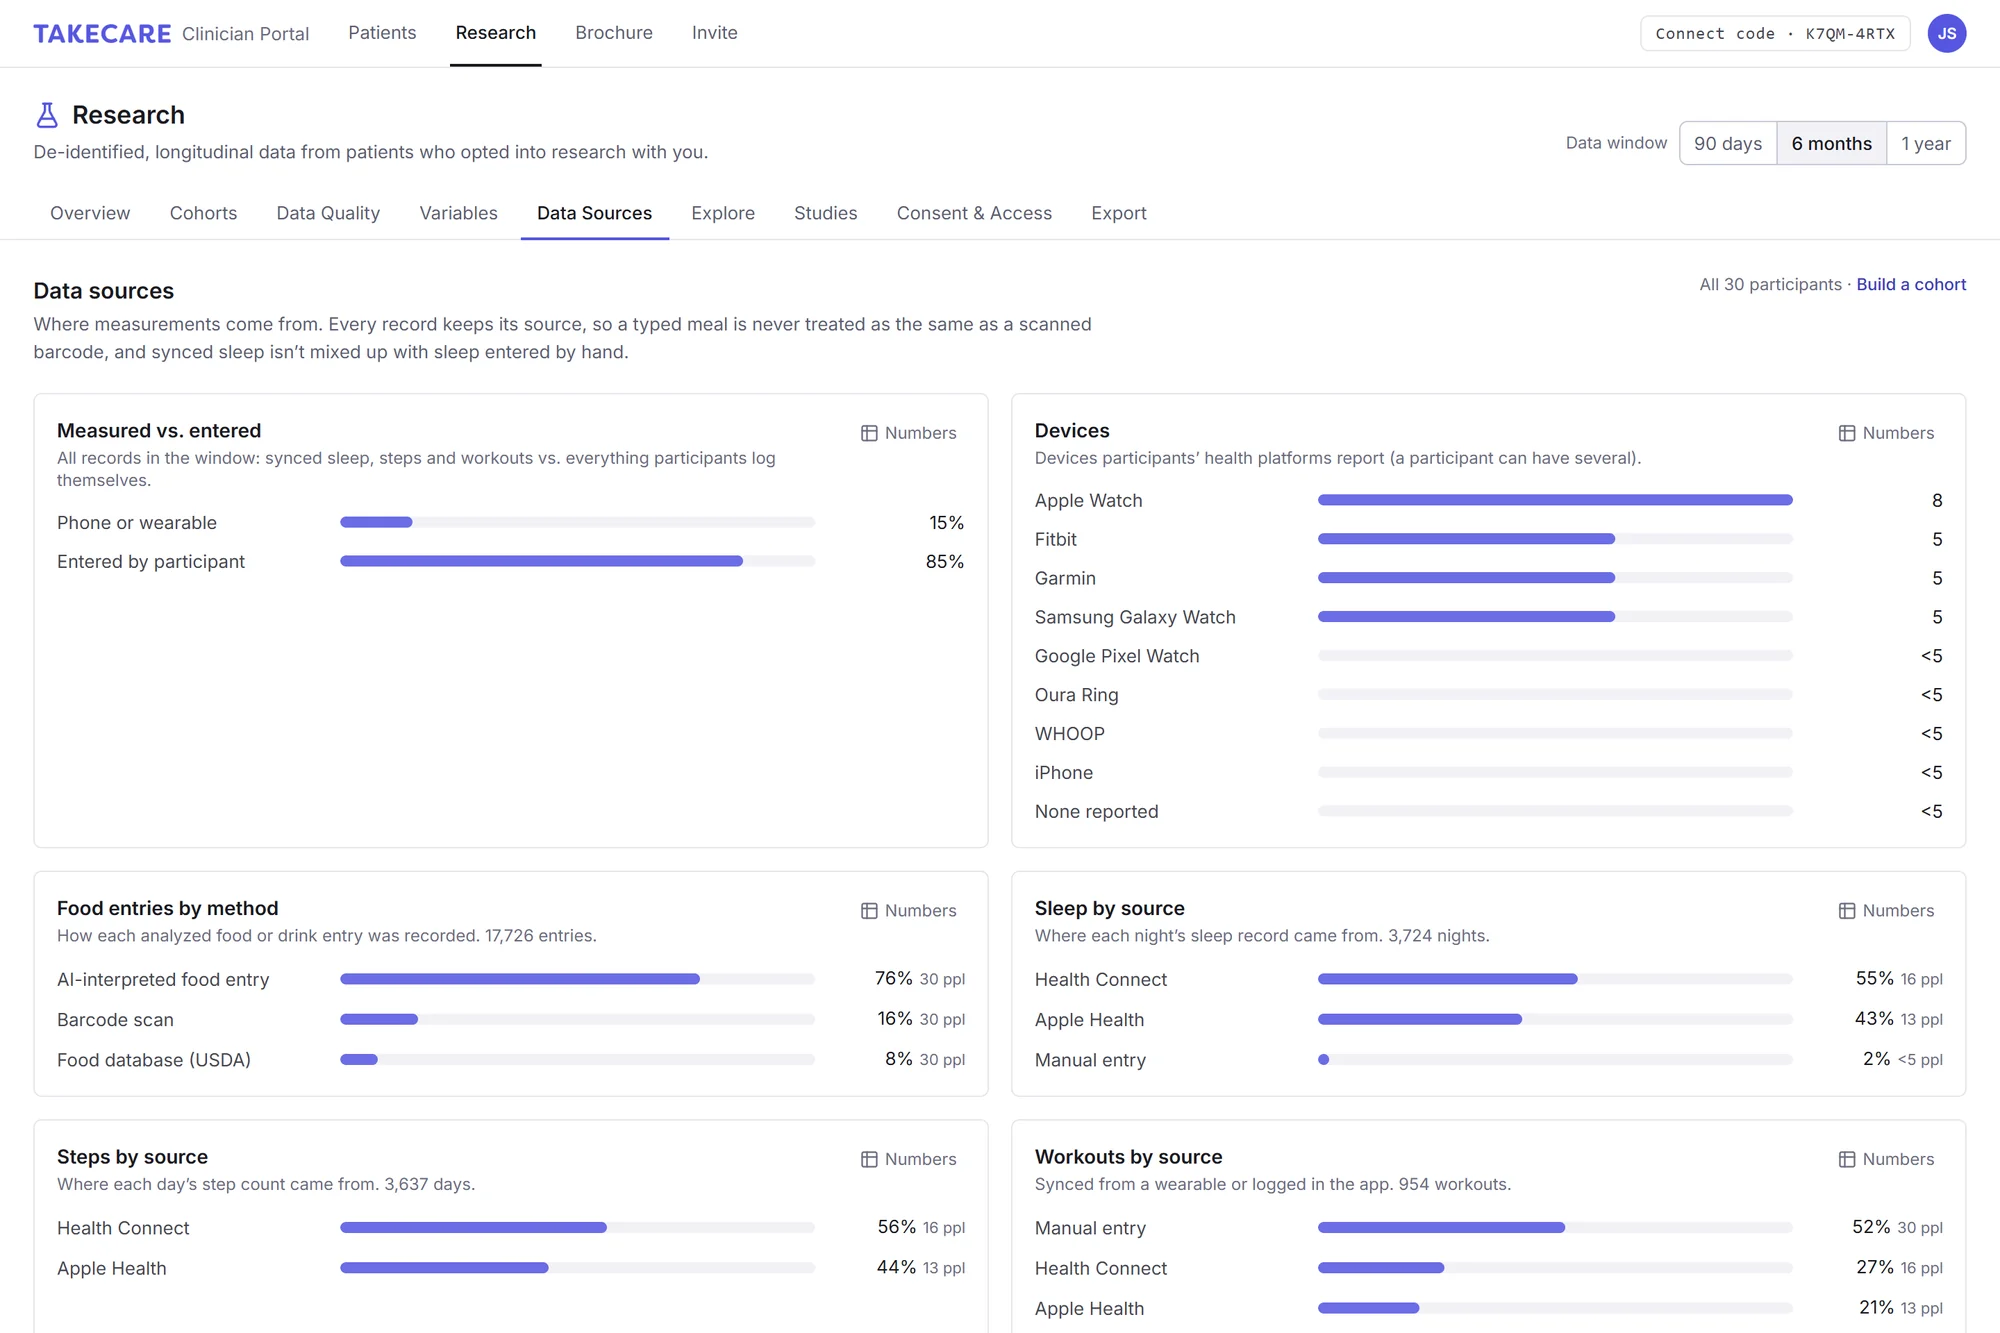
A typed meal is never treated the same as a scanned barcode, and synced sleep is never mixed up with sleep entered by hand. Source is kept on every record.
- Measured vs. entered: device data from Apple Health and Health Connect, kept apart from what participants log
- Devices: Apple Watch, Fitbit, Garmin, Samsung Galaxy Watch, Google Pixel Watch, Oura, WHOOP and phones
- Food by method: AI-interpreted entries, barcode scans (Open Food Facts) and the USDA FoodData Central database
A data dictionary you can cite
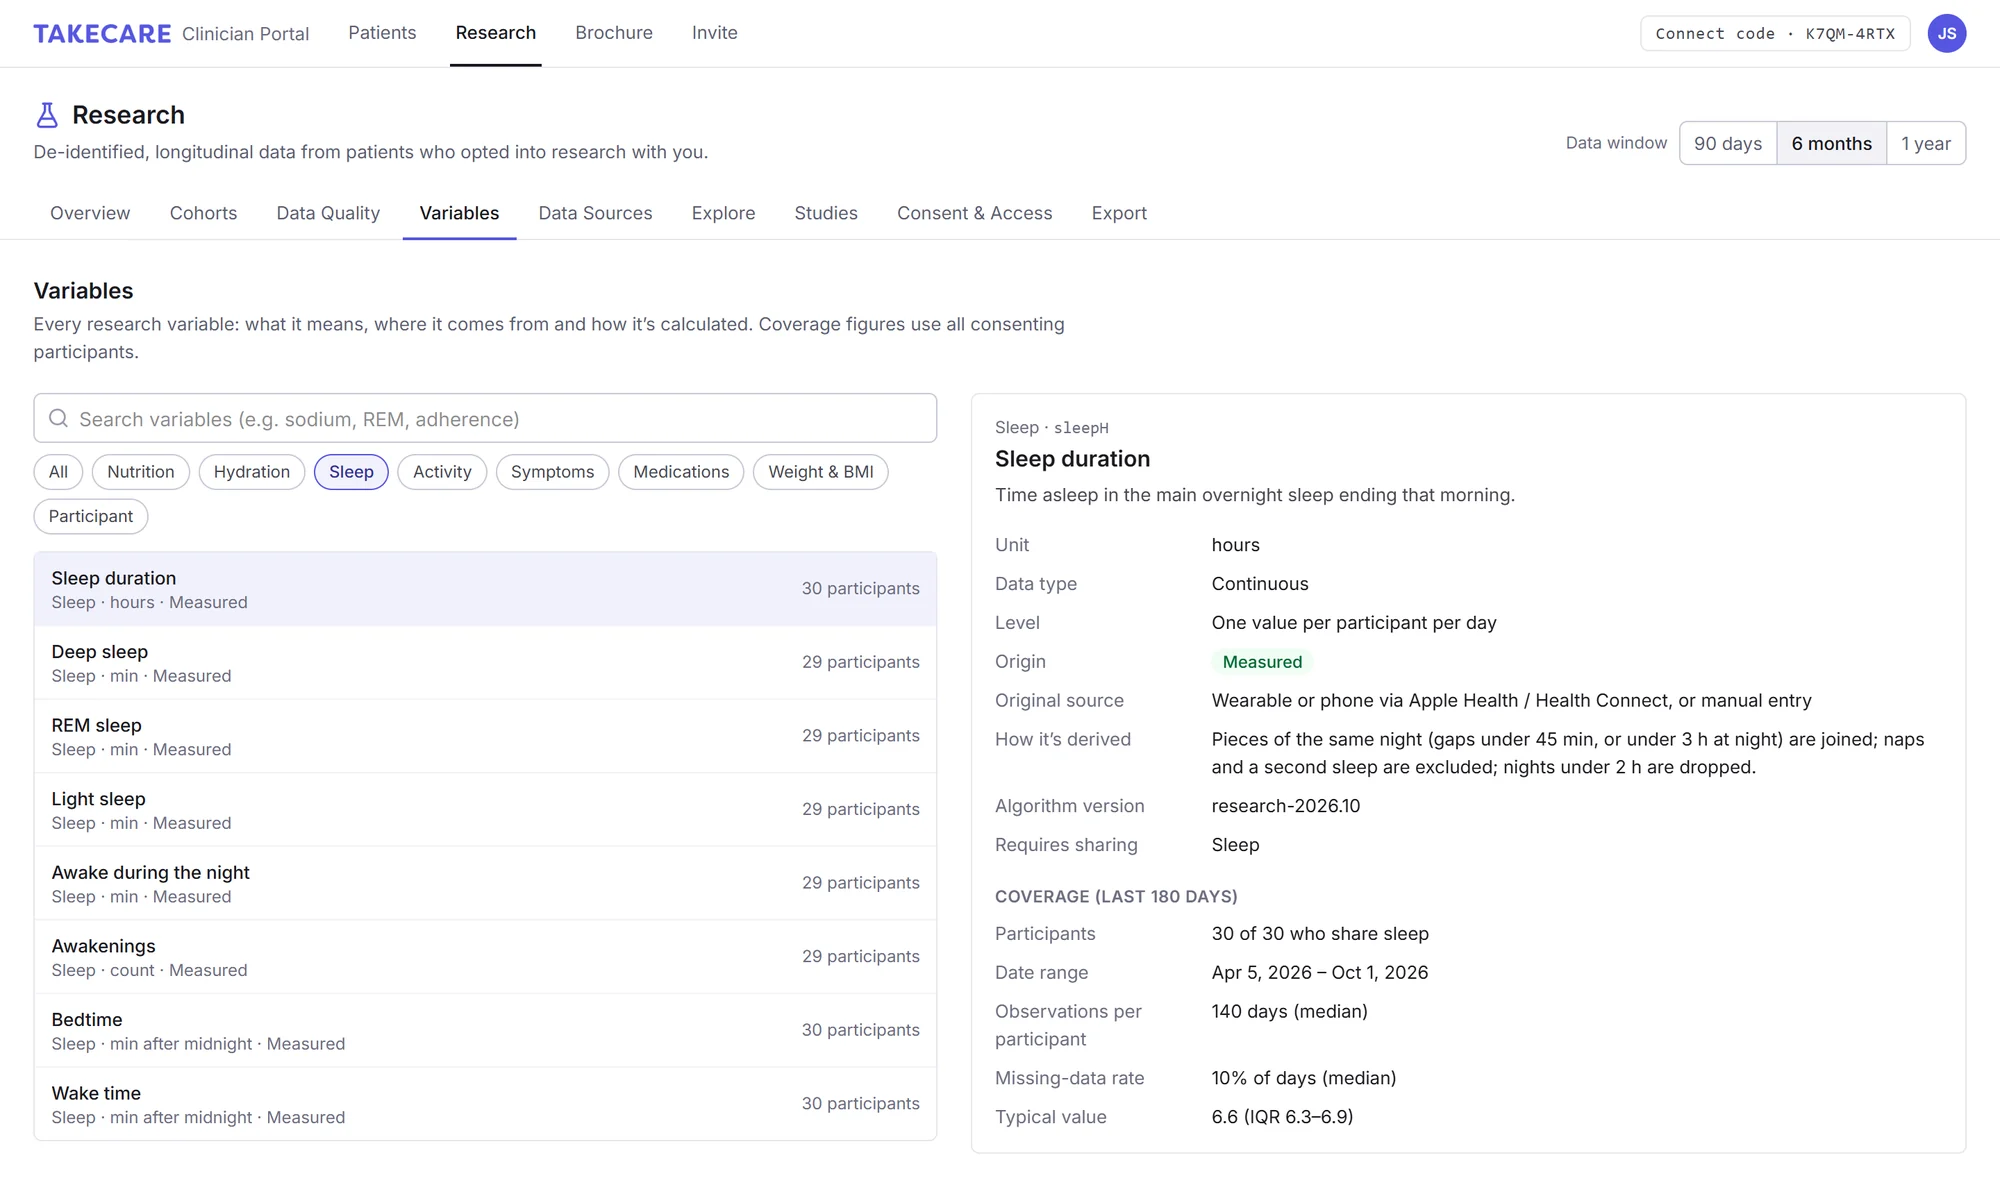
Every research variable is documented before you export it: what it means, where it comes from and exactly how it’s calculated, with coverage in your current data.
- Unit, data type and level (participant-day or participant) for all 36 variables
- Origin: measured, user-entered or calculated, with the original source and derivation
- Algorithm version on every variable and export, so results can be reproduced
Studies with a review step built in
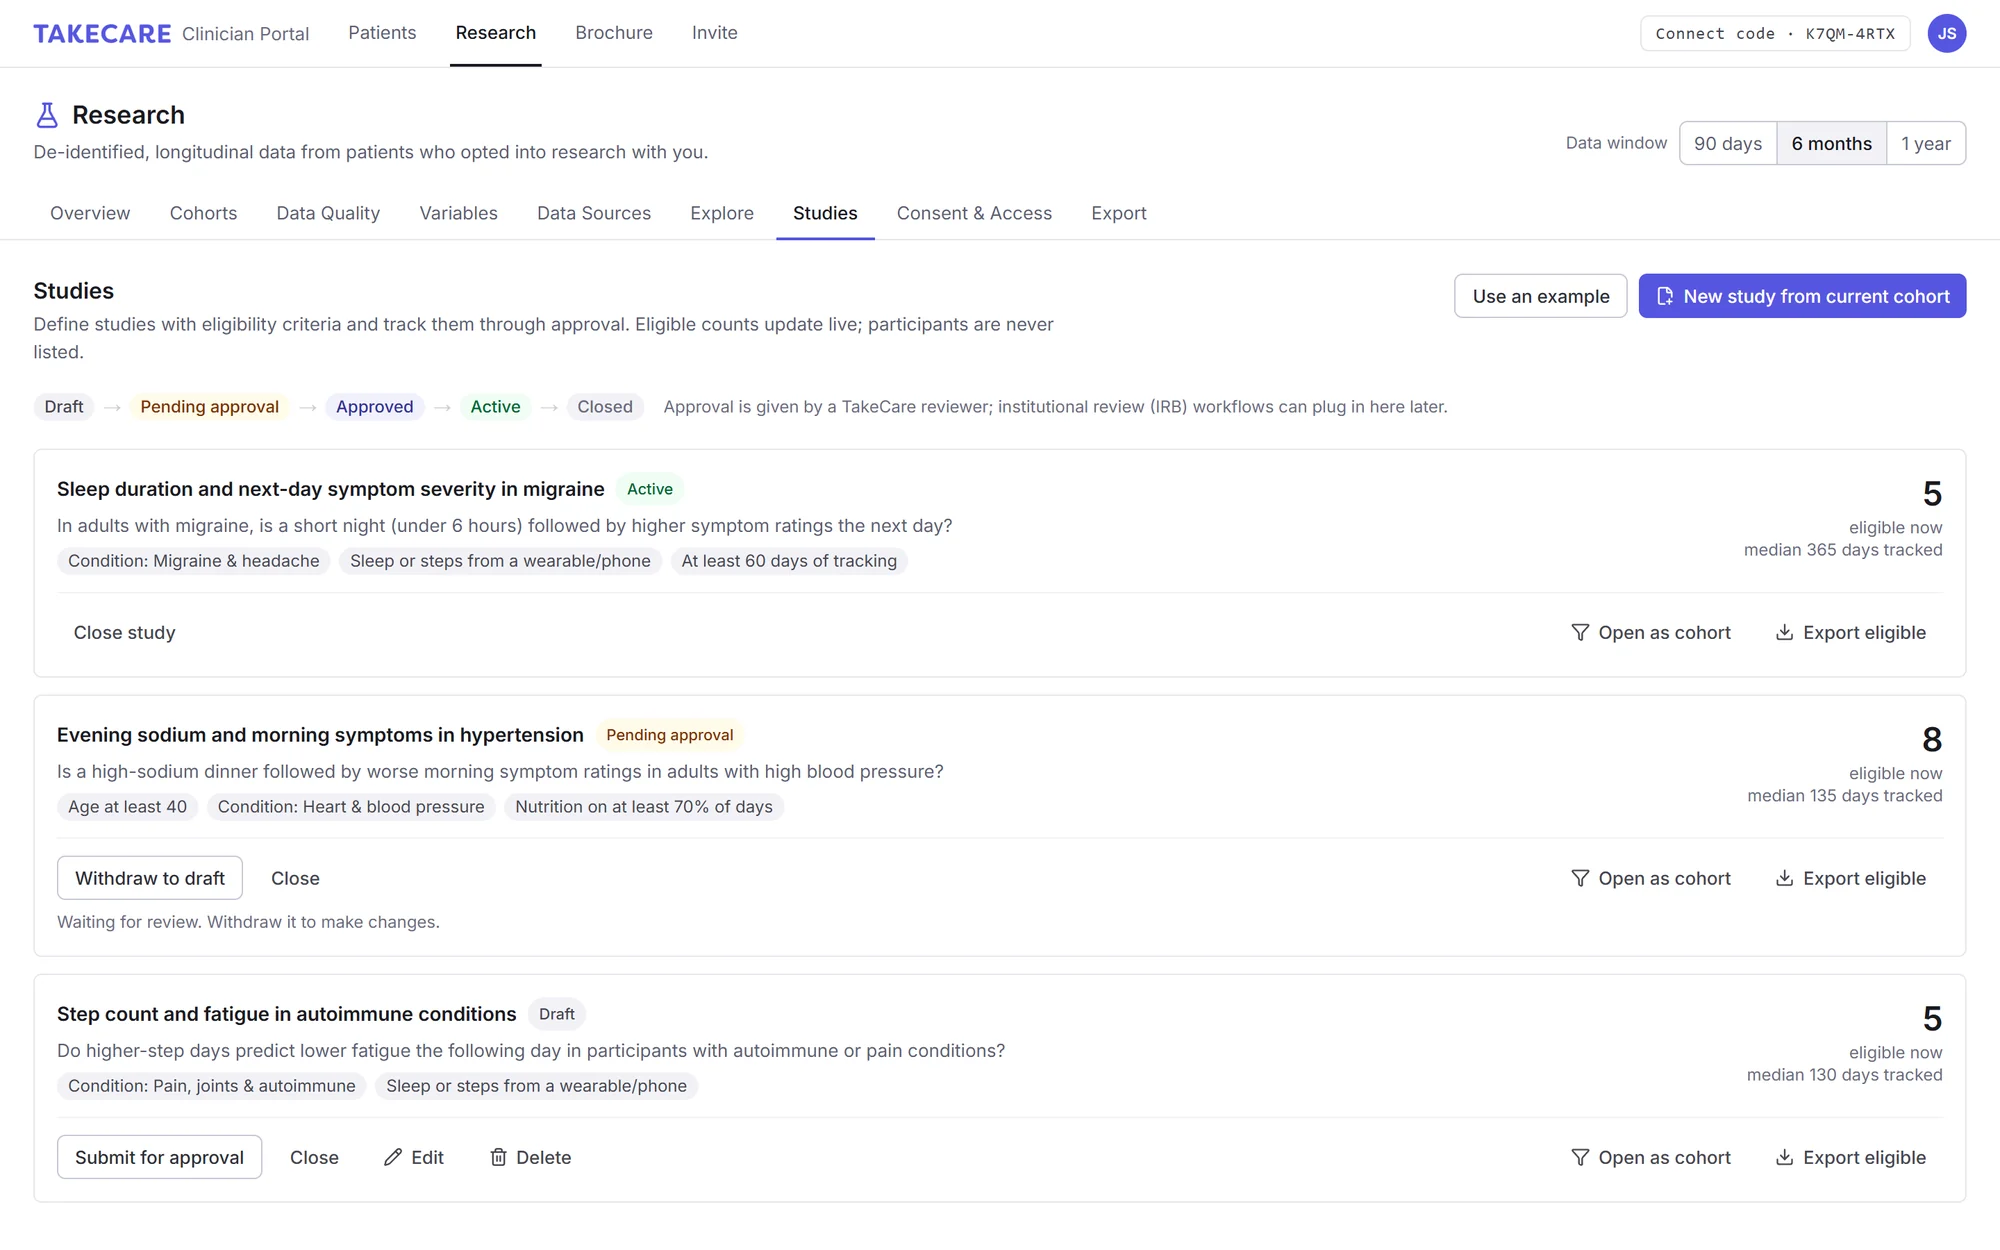
Write down your question and eligibility criteria, submit the study for approval, and track it through to the end. Eligible counts update live as participants join or leave; participants are never listed.
- Approval by a TakeCare reviewer before a study can start
- Open any study as a cohort or export its eligible participants in one click
- Locked once submitted: criteria can only change while a study is a draft
Analysis-ready files, documented
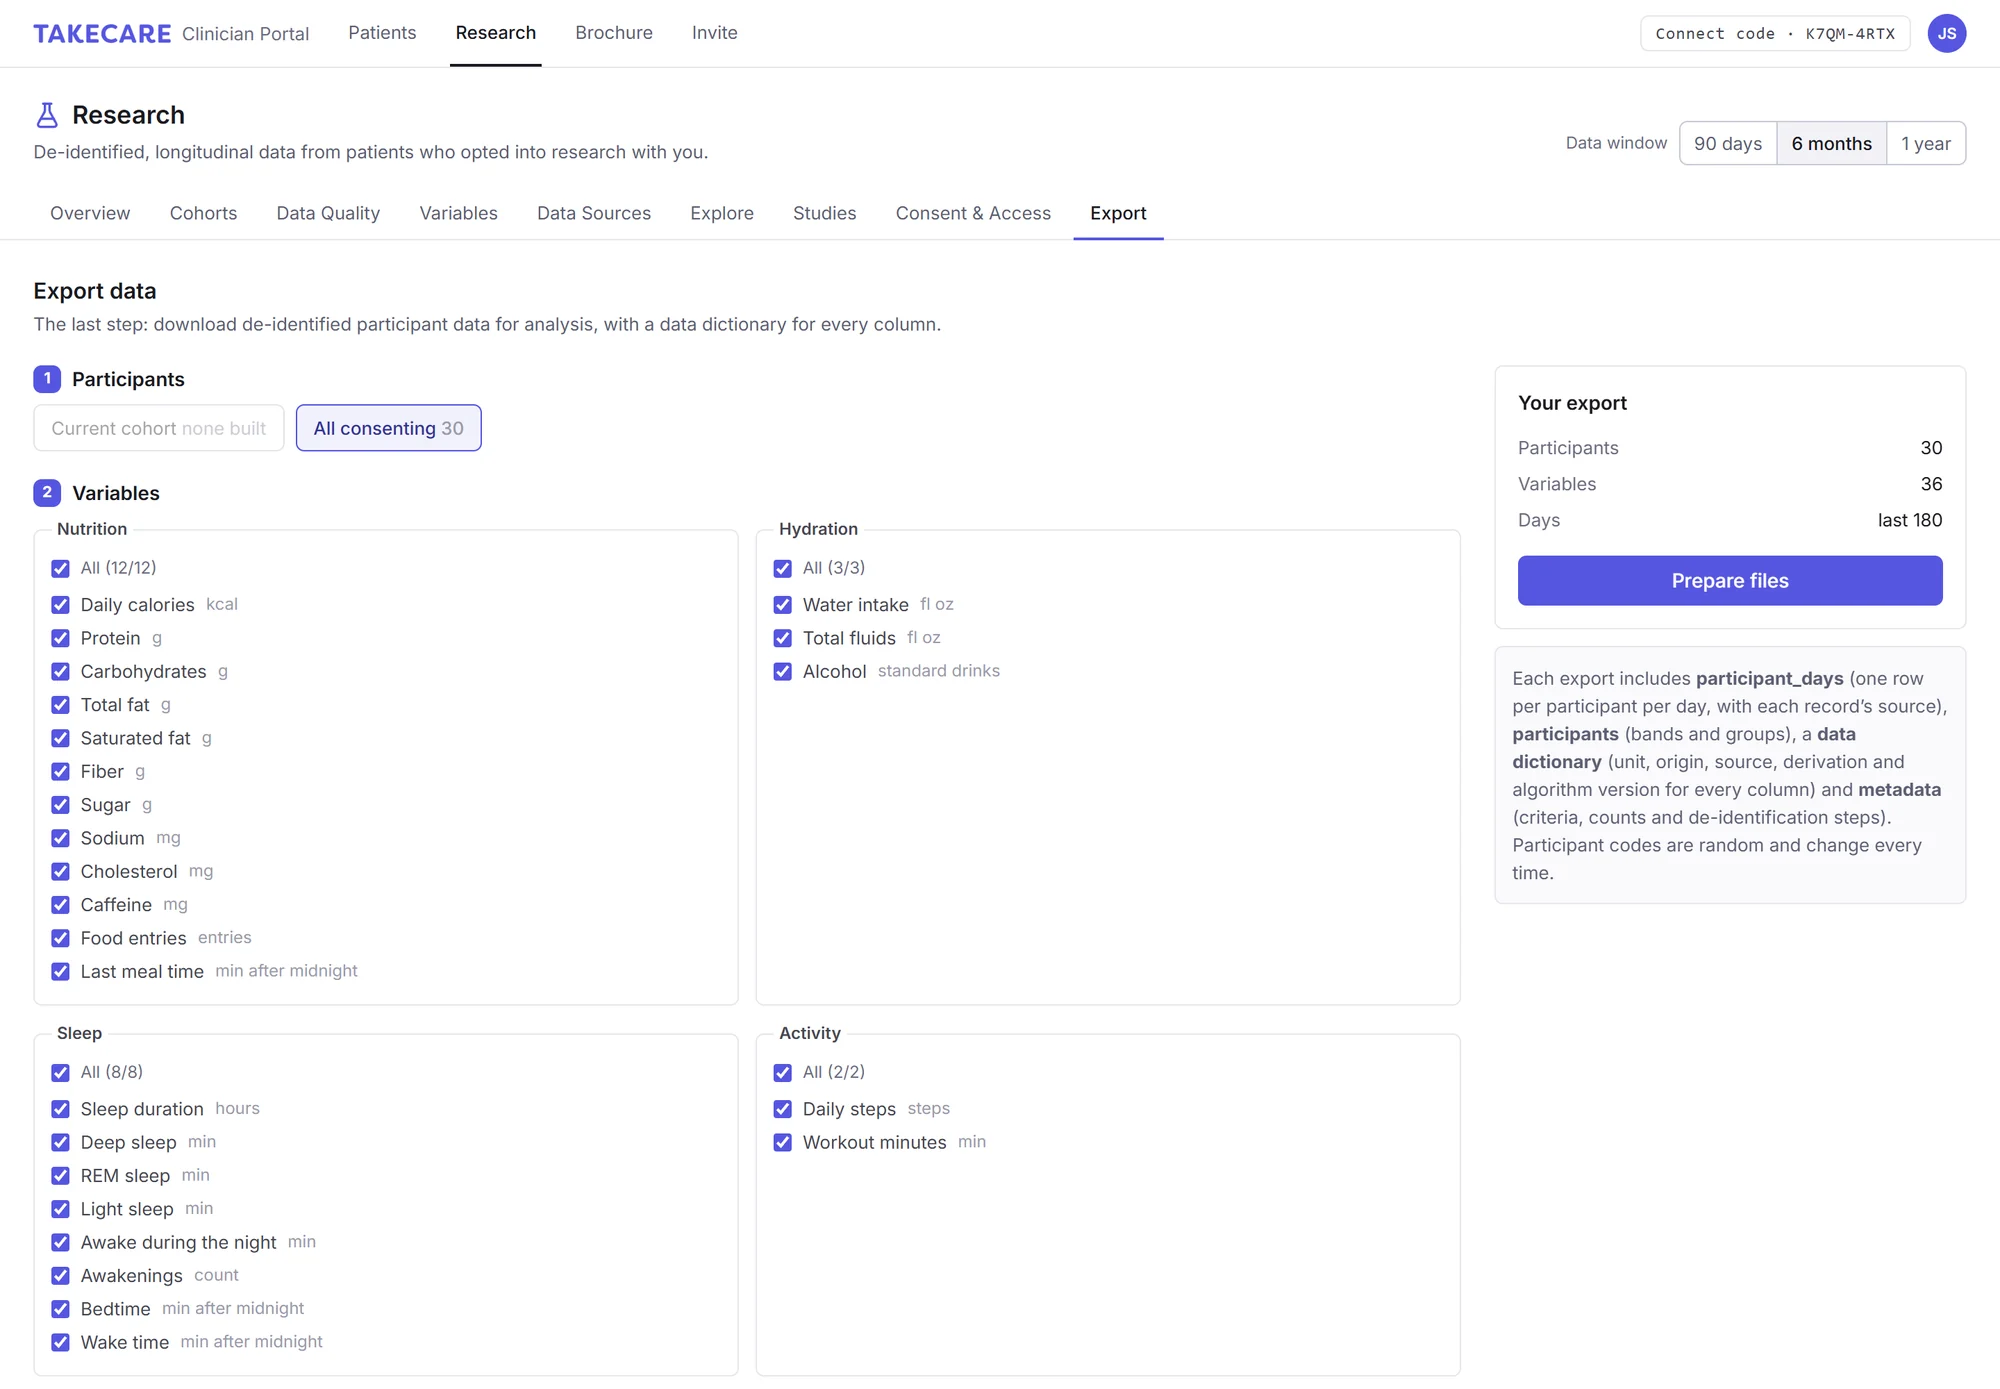
Choose your participants, variables and date range, and download de-identified CSVs that open in Excel, R, Python, SPSS and Stata.
participant_daysone row per participant per day, with each record’s sourceparticipantsage band, sex, BMI group, condition groups, medication classes and devicesdata_dictionaryunit, origin, source, derivation and algorithm version for every columnmetadatayour criteria, counts and the de-identification steps applied
- Random participant codes that change with every export, and study days instead of calendar dates
Nine sections, one workflow
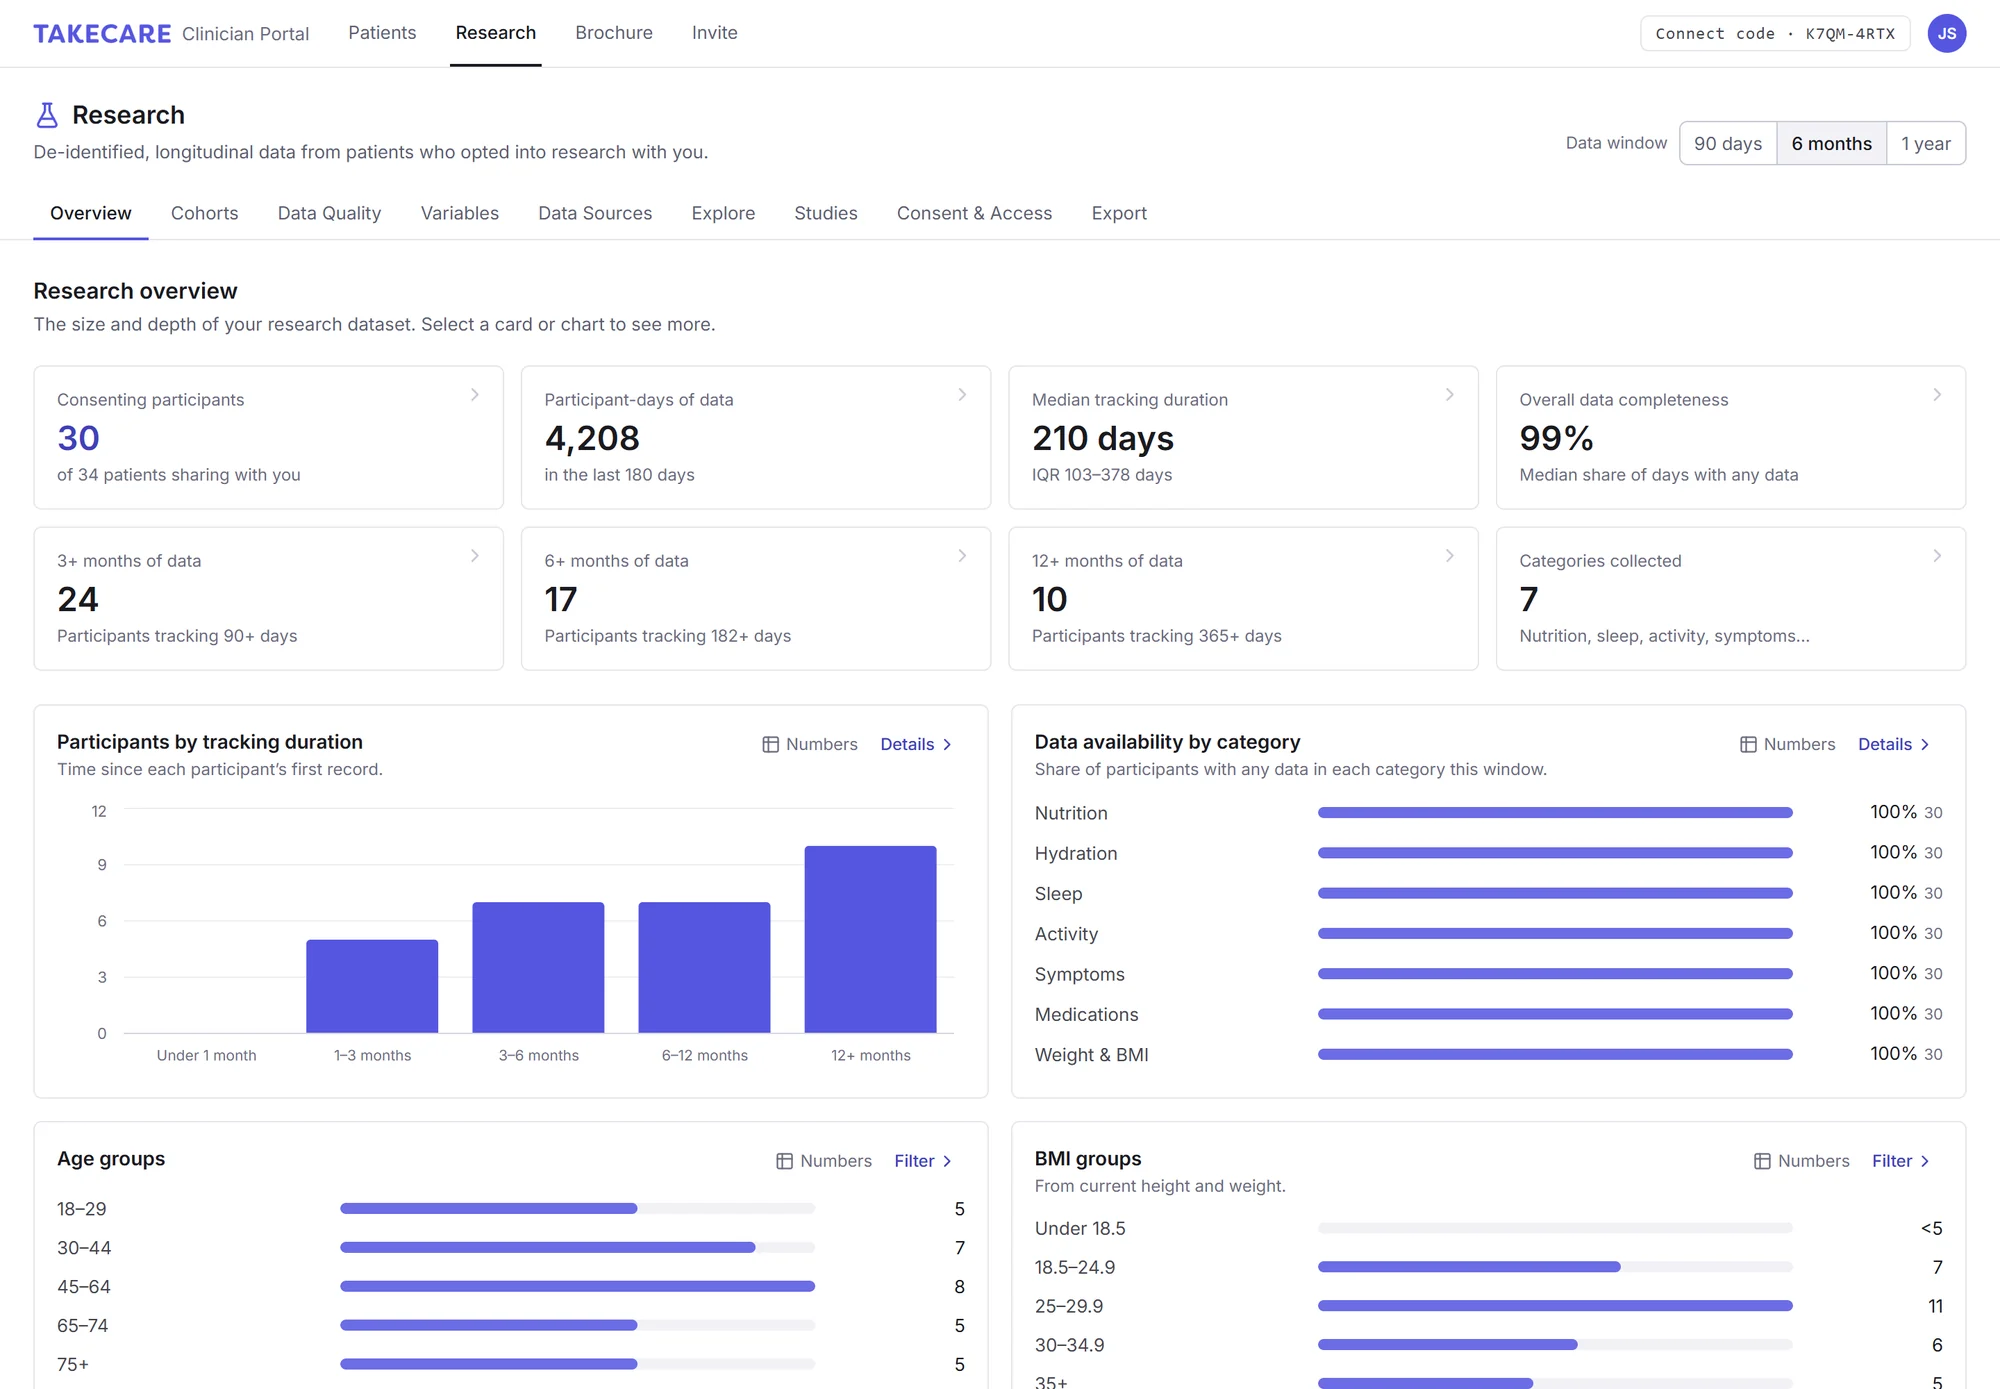
Switch the data window between 90 days, 6 months and a year. Everything you build in one section carries through to the next.
Overview
Participants, participant-days, tracking duration, completeness, and age, BMI, condition and device groups.
Cohorts
Build a population from demographics, conditions, medicines, data requirements and health measures.
Data Quality
Completeness, missing data, usable participants and continuous runs, by category.
Variables
A searchable data dictionary with sources, derivations and coverage for every variable.
Data Sources
Measured vs. entered data, devices, food methods, and where each night and step count came from.
Explore
Trends, distributions, group comparisons, relationships and within-person comparisons.
Studies
Questions and eligibility criteria, live eligible counts, and review from draft to closed.
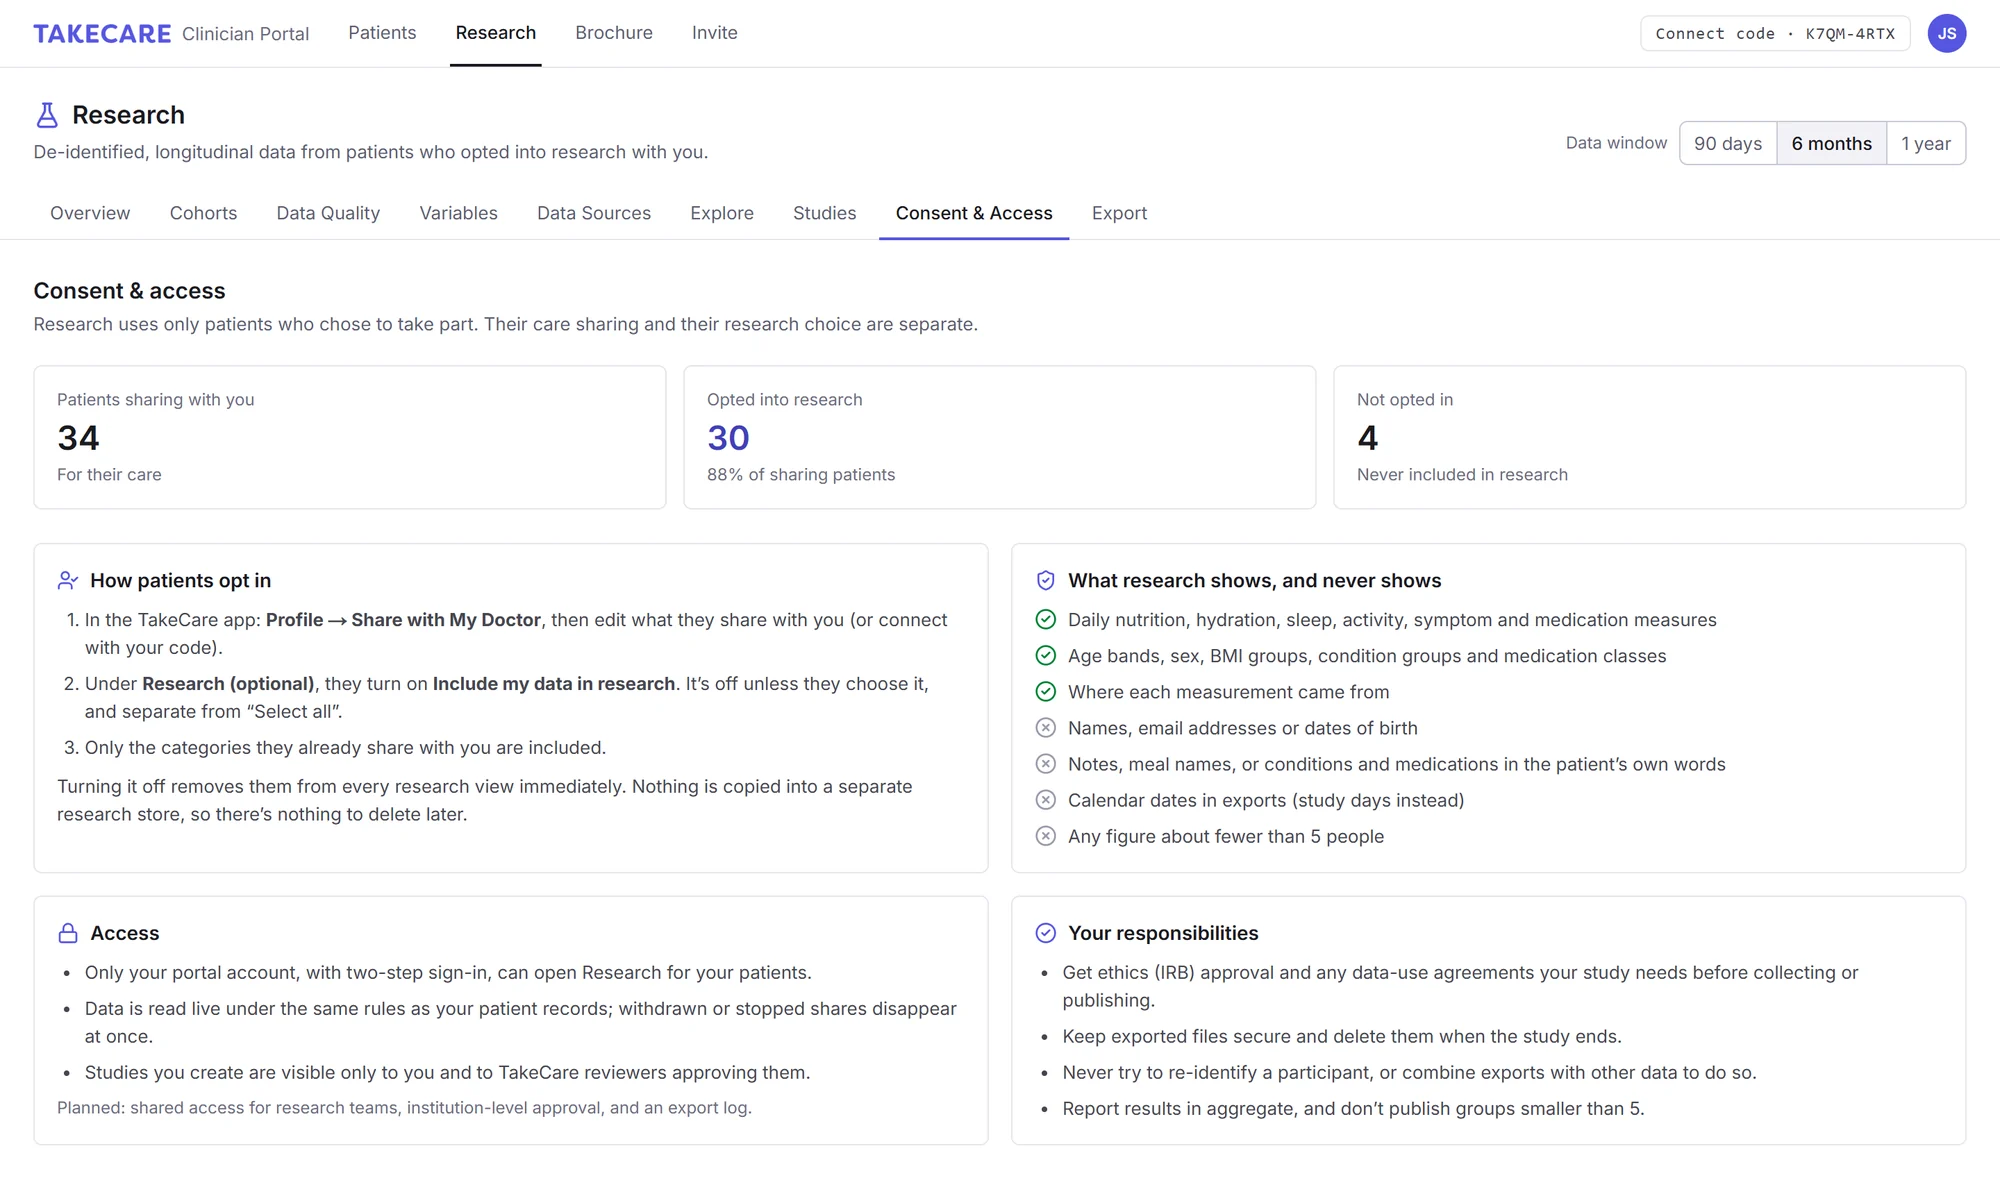
Consent & Access
Who opted in, how they did it, what research shows and never shows, and your responsibilities.
Export
De-identified CSVs with a participant-day table, participant table, data dictionary and metadata.
36 daily variables, plus the context to use them
Each participant shares only the categories they choose. Every variable below is documented in the portal and in the data dictionary that comes with each export.
Nutrition 12
- Daily calories
- Protein
- Carbohydrates
- Total fat
- Saturated fat
- Fiber
- Sugar
- Sodium
- Cholesterol
- Caffeine
- Food entries
- Last meal time
Sleep 8
- Sleep duration
- Deep sleep
- REM sleep
- Light sleep
- Awake during the night
- Awakenings
- Bedtime
- Wake time
Stages come from wearables that record them; manual nights are marked as manual.
Hydration & activity 5
- Water intake
- Total fluids
- Alcohol (standard drinks)
- Daily steps
- Workout minutes
Symptoms & medications 6
- Symptom severity
- Ratings per day
- Poor or Terrible ratings
- Missed doses
- As-needed doses
- Medication adherence
Body & participant 5
- Weight
- Height
- BMI
- Age (banded in exports)
- Tracking duration
Groups for every participant
- Age band
- Sex
- BMI group
- Condition groups
- Medication classes
- Devices
Conditions and medicines are mapped to fixed groups and classes, never exported as typed.
Participants decide. Every time.
Research uses only people who chose to take part, and never shows who they are.
Opt-in only
Research is a separate choice in the app, off unless participants turn it on and never part of “Select all.” Sharing for care doesn’t include research.
Withdraw instantly
Turning research off removes a participant from every research view right away. Nothing is copied into a separate store, so nothing is left behind.
Never identifiable
No names, email addresses, dates of birth, notes or meal names. Exports use random codes and study days instead of calendar dates.
No small groups
Any count, percentage, chart bar or day describing fewer than 5 participants is hidden, so no one can be singled out.
Two-step verification
Every portal account signs in with a password and an authenticator code. A stolen password alone can’t open research data.
Studies are reviewed
Studies you create are visible only to you and to the TakeCare reviewers who approve them before they start.
TakeCare is a wellness tool, not a medical device. Research data is self-logged and synced from consumer wearables, and patterns in the portal are associations, not evidence of cause. TakeCare doesn’t provide ethics approval: get IRB approval and any data-use agreements your study needs before collecting or publishing.
From sign-up to first export
No integration and no data-sharing agreement with an app vendor to negotiate. You work in your browser; participants use the free TakeCare app on iPhone or Android.
Create your account
Sign up, start your monthly subscription, and turn on two-step verification.
Invite participants
Share your connect code on a printable brochure or by email. Participants enter it, choose what to share and turn on research.
K7QM-4RTXBuild, check, export
Define your cohort, check data quality, explore, and download documented CSVs whenever you need them.
Screenshots show sample participants, not real people.
One price. No per-participant fees.
One monthly plan for the TakeCare Research Portal. Participants never pay to take part.
$299.99 per month
- Up to 20 team members, each with their own login
- Unlimited participants
- All ten research sections, from cohorts to exports
- Documented CSV exports with a data dictionary and metadata
Payment is processed securely by RevenueCat and Stripe after you create your account. Cancel anytime; you keep access until the end of the month you’ve paid for. See our refund policy.
Questions researchers ask
Who is TakeCare Research for?
Academic and clinical researchers, clinician-scientists, dietitians and nutrition researchers, sleep and digital health researchers, and graduate researchers studying how daily habits relate to symptoms in chronic conditions. Research is part of the TakeCare portal, so the same account also works for patient care.
How do participants join?
They install the free TakeCare app, enter your connect code, choose which categories to share, and turn on Include my data in research. Research is off unless they choose it, and it isn’t part of “Select all.” You can hand out your code on a printable brochure or send invitations from your own email.
Can participants withdraw?
Yes, at any time from the app. Turning research off removes them from every research view immediately. Nothing is copied into a separate research store, so there is nothing left behind to delete. Data you have already exported stays your responsibility to handle under your study’s protocol.
Will I see who my participants are?
Not in Research. It never shows names, email addresses, dates of birth, notes or meal names, and exports use random codes that change every time. Participants connect to your account the same way patients connect to a clinician, so the categories they choose to share also appear in your Patients list.
What data is included?
36 daily variables across nutrition, hydration, sleep, activity, symptoms, medications, weight and BMI, plus banded age, sex, BMI group, condition groups, medication classes, devices and tracking duration. Every variable is documented with its unit, origin, source and how it’s calculated.
How reliable is the data?
It’s real-world data, with the strengths and limits that come with it. Sleep and steps come from consumer wearables and phones; meals, doses and symptom ratings are logged by participants, and meal nutrition is estimated by analysis or taken from a food database. The source of every record is kept, and the Data Quality and Data Sources sections show completeness and origin so you can set inclusion rules that fit your question.
Do I still need ethics (IRB) approval?
Yes. TakeCare doesn’t provide ethics approval. Get IRB approval and any data-use agreements your study needs before collecting or publishing. Study approval in TakeCare is a separate review by TakeCare.
What file formats can I export?
CSV files that open in Excel, R, Python, SPSS and Stata: a participant-day table, a participant table, a data dictionary and a metadata file. Parquet is planned.
Is it a subscription?
Yes. It’s $299.99 a month for the TakeCare Research Portal, covering up to 20 team members, with unlimited participants. Participants never pay to take part. Cancel anytime.
The answers are in the days between study visits. Now you can see them.
Create your account in a few minutes and share your code with your first participants.